Measure and improve the health of your inventory over time.
Perhaps the biggest threat to the survival of today's independent furniture retailer is inefficient inventory management. Poor inventory practices are the norm in many retail operations and result in a cash flow drain rather than a cash flow gain.
This two-part series will look at ways in which you can measure and then improve the health of your inventory over time.
It doesn’t matter if you are an independent, a branded store or big box; your return on inventory determines the velocity of your cash flow. The faster you turn your merchandise and the higher the margin you turn it at, the faster you will accumulate cash. Retailers who focus primarily on maximizing sales volume will produce average results at best. High profit companies place equal focus on the quality of their inventory. If you can execute dynamic inventory management better than your competitors, you will easily outperform them in both profit and cash flow.
The first step to take if you want to maximizing cash flow with dynamic inventory management is to check your metrics often. If you skip this step, you cannot possibly know where to apply your talent and business resources to maintain your inventory mix at optimal levels. Once you have a true picture of the quality of your inventory, and compare it with internal or external benchmarks, you will be aware of your strengths and weaknesses. Only then will you be able to set realistic goals for improvement, and take action. Here are some key metrics that you should calculate:
GMROI: Increasing gross margin return on inventory (GMROI) should be a primary business objective. The higher your GMROI, the faster your cash flow velocity. This metric measures how many gross margin dollars you produce per dollar of inventory invested. High profit stores typically get $2.94 in GMROI while low profit stores have a GMROI of around $2.02. The difference of $0.92 translates into $920,000 per year in gross margin for an operation with a million dollars in inventory! GMROI = annualized gross margin dollars / inventory on hand. Use average inventory numbers if you have them, but keep the time-frame shorter than three months, so that you can gauge improvement. Gross margin dollars are calculated by deducting cost of goods sold from net sales.
Inventory to sales ratio: This ratio serves as a quick gauge of whether or not you are over-inventoried for your projected sales volume. Measure this ratio by dividing inventory on hand by annual sales. Most profitable companies maintain a ratio of not more than 15 to 20%. It is also a useful indicator when looking at purchasing new product. A good rule of thumb is to buy only best sellers and special order items if you are over your target level. Never purchase new product if you are running an inventory to sales ratio higher than your goal. Your inventory number includes all reserved, damaged and nail-down items and sales are annualized or realistically projected.
Sales per square foot: This metric measures the efficiency of your showroom. It shows you where you could be for your current size. In the field, we typically see well-operated stores running between $200 - $500 sales/ square foot.
Best seller in-stock days: The well established 80/20 rule of retail says that the top 20% of your items generate 80% of your gross margin dollars. The bottom 80% produce only 20% of your gross margin dollars, with many items producing $0. Items that fall within your top 20% are your best sellers while those in the bottom 80% that produce $0 are your dogs. Once you have identified the top 20% of your items, see how often they are in stock. The best stores have their best sellers in stock 95% of the time. The greater the amount of time you have your best items in stock and the fewer your stock-out days, the faster you will generate cash.
Percentage of current inventory: This ratio tells you the percentage of your current inventory that is either a best seller or a new item. Measure it by adding your best sellers in inventory to items in stock for less than 60 days (new items) and dividing the total by your total inventory. The result is an indicator of whether or not you are effective in turning slow moving items fast to make room for new merchandise. Companies with a small proportion of their inventory that is current, tend not to be trying new items often enough because they are clogged with slow or not selling items (dogs). They have not reacted quickly enough to rectify the situation. Well-run operations have a high percentage of current merchandise (commonly above 75%). They recognize and sell their dogs fast and they purchase new items to replace dogs, fast.
Merchandise to display percentage: You can only sell something if your customers and salespeople know about it. Furniture retailers of all sizes often have substantial amounts of merchandise not on display. This metric is defined as the number of displayable SKUs in a warehouse divided by the total number of SKUs. Try to have less than 2% of available items not on display, at any given time. The faster you identify and display these items, the greater your turns will be.
Percentage of sales complete for delivery and scheduled: Over 90% of your completed sales should be scheduled for delivery or pick-up. Everyone in your operation works hard to help customers complete their rooms, yet you may find that you are slow to notify and schedule customers when their merchandise is ready. The best stores keep their customers informed through the entire process from initial greeting to after delivery. Track this ratio so that you become more proactive in your efforts to notify and deliver to your customers. Gross margin is only realized after delivery, so the less time reserved merchandise sits in your warehouse, the greater your turns, GMROI and cash flow will be.
Check these metrics at least once a month so that you can spot problem areas and use management tools to advance performance improvement. Retailers who monitor these metrics consistently, increase GMROI and realize higher levels of profit and cash flow.
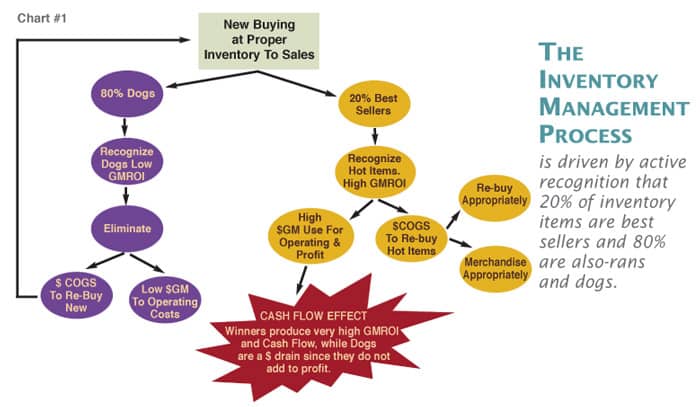
The Process of Dynamic Inventory Management
The diagram (above) outlines the process of dynamic inventory management. One of the key assumptions, borne out by experience, is that only 20% on average, of the new merchandise you buy, will become best sellers and contribute to 80% of your gross margin dollars. The majority of the remaining 80% will not generate any sales until they are eventually identified and finally sold off.
The process is driven by active recognition that 20% of inventory items are your best sellers, and 80% are also-rans and dogs. The usefulness of the chart is that it outlines a process for reinvesting your inventory dollars in a way that will maximize GMROI and cash flow
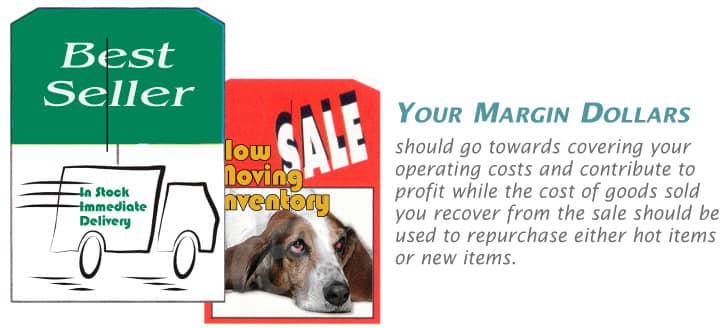
Your margin dollars (Cost Of Goods Sold minus Net Sales) should go towards covering your operating costs and contribute to profit, while the cost of goods sold that you recover from the sale should be used to repurchase either hot items or new items. The sales proceeds from your best sellers should be used to repurchase best sellers at the correct time and in the correct quantities. With the eventual sale of dogs you should repurchase new items, only if you are at a proper inventory level (15%-20% inventory to sales). You should never re-buy a dog.
Be aware of the fact that your inventory is constantly changing, and eventually best sellers do become dogs. It is important to monitor your metrics, so, when you see that a best seller isn't selling anymore, act fast.
Keep this chart displayed in your War Room and refer to it often. It represents your chain of inventory management. When you strengthen a link in this chain, your GMROI and cash flow will increase.
Next issue
This series will continue with a discussion of how to execute dynamic inventory process in the “real world” by defining the task, assigning responsibility and defining objectives and measurements.
David McMahon is a Senior Business Consultant for PROFITsystems, Inc. PROFITsystems delivers a "Total Success System" through PROFITprofessional, PROFITconsulting, PROFITgroups, PROFITuniversity, PROFITfreight, and PROFITservices. These business units offer best-practice solutions designed to maximize cash flow and profitability. Questions can be sent to David care of FURNITURE WORLD at davidm@furninfo.com.