
Editor's note: In the July/August issue David McMahon presented ideas to help furniture retailers improve their warehouse facilities and processes (see https://www.furninfo.com/Authors/David percent20McMahon/6). This time he introduces distribution center operations metrics essential to measuring the performance of any distribution center (DC).
The purpose of DC and warehouse operations is threefold.
- To fulfill sales promises to customers.
- Enable further sales.
- Add value to the products and services that the business sells.
Sales is mentioned three times in this definition because it's essential to reinforce the importance of the connection between customer-facing sales and customer-fulfillment operations. They are directly linked.
Too many companies fail to acknowledge this. Some operate as if sales and warehousing are an inconvenience to each other. Let me be clear. There are no sales without fulfillment. There are no operations without sales. When both are strong and support each other well, businesses prosper.
DC Operations Measurement
What are the best ways to measure the performance of your sales and DC operations?
It is fairly routine in most companies to analyze sales floor performance. I’ve written extensively in previous Furniture World editions how sales teams use metrics such as revenue per customer, average sale, close rate, traffic, and GMROI.
It is less routine for home furnishings companies to analyze DC performance. So, the rest of this article will provide suggestions about metrics you can adopt to monitor the pulse of sales support operations. It is important to note that when using metrics:
1. Track what makes sense for your individual business situation. Don’t track and put equal focus on every metric.
2. Set a “north-star” metric. This is the most important metric to improve.
3. Understand what other similar businesses can achieve, BUT focus on improving your benchmark average first, and adopt best practices.
4. Set actions, and be sure to review your metrics often.
Raw Data For XYZ Furniture
Here a real-life example for a company we will call XYZ Furniture that includes the following raw data for determining DC operation metrics:
- Annual sales volume supported by operations is $20,000,000.
- Annual cost of inventory related to that volume is $10,000,000.
- The number of DC operations people is 25.
- The number of hours worked per week total is 1125.
- The number of trucks in use is five.
- The number of deliveries (shipments to customers) per week is 200.
- The number of deliveries per week at capacity is 250.
- The number of customer pick-ups per week is 50.
- The number of dock-height doors is 15.
- Total DC square footage (ground space) is 50,000.
- Total DC square footage used for staging for merchandise receiving, transfer, preparation and shipping is 10,000.
- The number of deliveries per week is 200.
- The number of delivery issues per week (customer complaints, damages, defects, returns, refusals) is 15.
- Inventory value reserved for customers in warehousing is $800,000.
- Inventory value available for sale in warehousing is $1,200,000.
- Inventory value non-sellable (i.e. damaged, missing) in warehousing is $20,000.
- Total inventory value in warehousing is $2,020,000.
Metrics Calculations
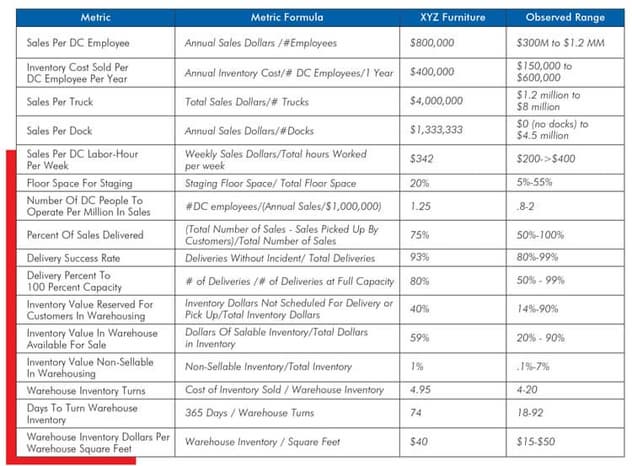
The chart below includes formulas for a number of warehouse metrics that can be observed using this raw data.
Metrics Interpretation
Sales per DC employee: At a volume of $20 million in annual sales, XYZ's 25 employees support $800,000 in sales volume each on average. I’ve observed ranges of $300,000 to $1.2 million for this metric in other operations.
Inventory cost sold per DC employee per year: $400,000 is how much inventory is handled per employee. This disregards the margin salespeople sell at. Growing sales or cost sold per DC employee while maintaining operational effectiveness would produce more profit for XYZ Furniture.
Sales per truck: Each of XYZ Furniture's five trucks currently ship $4,000,000 at retail to customers per year. That would be $100,000 per week each, or $50,000 per week at cost sold. Calculating sales per truck helps measure the efficiency of each truck.
Sales per dock: $1,333,333 at retail pass through the 15 docks in this operation per year. DC’s are like a funnel with multiple spouts. The proper number of spouts (docks) are an important factor determining the speed of merchandise flow.
Sales per DC labor-hour per week: At XYZ Furniture, one hour of labor supports $342 in retail sales. This is a top effective efficiency metric. I have seen ranges from under $200 to over $400. Being too high here might mean an over capacity situation, while being too low can mean an ineffective use of resources and processes. It is important to calculate this metric and find your happy medium.
Floor space for staging: 20 percent of this operation's DC floor space is used for non-storage activities. It is critical to have the proper amount of room to flow inventory fast, without damages.
Number of DC people to operate per million in sales: It takes 1.25 people involved in warehouse operations to support $1 million of retail sales. This metric is helpful when determining how to hire additional employees as sales operations grow, or reduce resources in the event of a sales decline. It also highlights the importance of a sales force achieving a high gross margin. With higher gross margins, a given number of people can deliver a greater volume without adding extra cost. I’ve observed ranges of .8 to 2 people per million with this metric in other operations.
Percent of sales delivered (shipped to customer): seventy-five percent of sales at XYZ Furniture are shipped to customers. Twenty-five percent are picked up. Both require resources, and both have pluses and minuses. Delivery to customers generally generates extra cost. Appropriate shipping charges and/or margins need to be achieved to sustain DC costs with a high shipping percentage of sales. I’ve observed ranges of 50 percent to 100 percent with this metric in other operations.
Delivery success rate: ninety-three percent of the sales at XYZ Furniture are delivered without any issues. That means that seven percent have issues. These problems are costly in terms of customer satisfaction, labor hours, and lost margins. All operations should track this rate, identify the common issues, continually improve processes and setup incentive systems based on continuous improvement. I’ve observed ranges of 80 percent to 99 percent with this metric at other home furnishings operations.
Delivery percent to 100 percent capacity: This operation is running at 90 percent to capacity for shipping. That means that up to 10 percent more could conceivably be delivered to customers before new resources need to be added.
Inventory value reserved for customers in warehousing (percent of total): Forty percent inventory is reserved for customers. There will always be a certain amount of inventory in any operation having reserved inventory status. The important thing to do is minimize the amount of time this inventory is kept in inventory. Shipping dates should be scheduled for just about all inventory housed in the DC. If this is being done, and there is still a significant backlog of reserved merchandise, additional capacity might need to be added, or existing resources and processes may need to be improved. I’ve observed ranges of 14 percent to 90 percent with this metric in other operations.
Inventory value available for sale in warehousing: Fifty-nine percent of inventory in XYZ Furniture's DC is salable. This should either be back-up stock of best sellers or merchandise that is currently in the process of being transferred to the floor for sale. Non-best selling merchandise or non-scheduled floor inventory in facilities other than showrooms, are cash killers.
Inventory value non-sellable (i.e. damaged, missing) in warehousing: One percent of inventory is total waste product in XYZ Furniture's DC. Operations should seek to keep this under one percent at all times and routinely preform cycle inventory checks to confirm. Ignorance of a problem is not the absence of a problem. I’ve observed ranges of .1 percent to seven percent with this metric in other furniture operations.
Warehouse Inventory Turns: This operation turns its total warehouse inventory 4.95 times per year. Growing sales and margins while reducing the time merchandise spends at DC facilities will maximize back-end operational effectiveness. I’ve observed ranges of 4 to 20 warehouse turns with this metric in other operations.
Days to Turn Warehouse Inventory: Speaking of time spent, in this example the inventory stays 72 days on average in the warehouse. I’ve observed ranges of 18 days to 92 days with this metric at other operations.
Warehouse Inventory Dollars per Warehouse Square Feet: At 50,000 square feet of warehouse space and $20 million in annual sales, this warehouse produces $40 of sales per square foot. A good number here could indicate a facility that is purpose built with effective height and racking. A low number could also indicate a facility that is too large for its current volume, which in turn may indicate the ability to grow volume if it makes sense in the region's distribution market range. A very high number may indicate an operation that is at capacity and performing well for its sales volume. Alternatively, it could mean the facility is inef- fective for the current operation and hindering sales growth. I’ve observed ranges of $15 to $50 with this metric in other operations.
Conclusion
When you interpret these metrics and apply them to your business you should consider your unique situation, decide what is important, and develop actions to improve. Ultimately you should seek to benchmark against YOUR current standard, and use best industry practices to produce greater sales, margins, profit, and cash from your DC and warehousing operations.
Author's Note: In our LEAN DC operations performance group we compile a fair number of additional metrics, but the metrics presented in this article are a good start for any operation that wants to keep track of DC metrics itself. Additional measurements can include more detailed employee job functions, service related items, racking analysis, and expense spend for sales support facilities, equipment, supplies and people.